Saturday, January 23, 2010

Earth Structure: Fluid Factory In Solid Earth

Earth is a giant fluid factory, according to Santosh and coworkers, researchers from Japan. The authors propose a new model for the nature and distribution of fluids from the core to Earth’s based on modern concepts of plate tectonics and argue that fluids within Earth play a critical role in constraining both the interior Earth dynamics and the evolution of the surface and near-surface environment.

They are of the opinion that the global material circulation in our planet is controlled by a combination of processes that operate on the surface of Earth (plate tectonics), in the intermediate depths (plume tectonics), and at the core-mantle boundary region (anti-plate tectonics). They envisage that hot, rising plumes act as giant pipes connecting the deeper portions of Earth with the surface.

Santosh et al. propose that free fluid circulation within Earth occurs only within restricted zones, such as along regions were tectonic plates are subducted. The water subducted along the plate boundaries reaches up to the 410-660 km boundary termed as the mantle transition zone. Water stored in dense hydrous silicates in this region constitutes a huge water tank with a capacity of nearly five times the volume of the water in modern oceans.

The authors also propose that for the major part of Earth's history, the fluid transport was mostly one way -- from the outer core to the surface. The return flow of water probably started 750 million years ago and the penetration of water to deep levels through plate subduction provided adequate lubrication to transport some of the deeply subducted rocks back to the surface in the younger Earth. Such rocks returned from depth are identified from their ultrahigh-pressure mineral assemblages.
Adapted from materials provided by Geological Society of America.

Journal Reference:
Santosh et al. A fluid factory in solid Earth. Lithosphere, 2009; 1 (1): 29 DOI: 10.1130/L2.1

Ten Questions Shaping 21st-Century Earth Science Identified

Ten questions driving the geological and planetary sciences were have been identified in a new report by the National Research Council. Aimed at reflecting the major scientific issues facing earth science at the start of the 21st century, the questions represent where the field stands, how it arrived at this point, and where it may be headed.

"With all the advancements over the last 20 years, we can now get a better picture of Earth by looking at it from micro- to macro-perspectives, such as discerning individual atoms in minerals or watching continents drift and mountains grow," said Donald J. DePaolo, professor of geochemistry at the University of California at Berkeley and chair of the committee that wrote the report. "To keep the field moving forward, we have to look to the past and ask deeper fundamental questions, about the origins of the Earth and life, the structure and dynamics of planets, and the connections between life and climate, for example."

The report was requested by the U.S. Department of Energy, National Science Foundation, U.S. Geological Survey, and NASA. The committee selected the question topics, without regard to agency-specific issues, and covered a variety of spatial scales -- subatomic to planetary -- and temporal scales -- from the past to the present and beyond.

The committee canvassed the geological community and deliberated at length to arrive at 10 questions. Some of the questions present challenges that scientists may not understand for decades, if ever, while others are more tractable, and significant progress could be made in a matter of years, the report says. The committee did not prioritize the 10 questions -- listed with associated illustrative issues below -- nor did it recommend specific measures for implementing them.

How did earth and other planets form?

While scientists generally agree that this solar system's sun and planets came from the same nebular cloud, they do not know enough about how Earth obtained its chemical composition to understand its evolution or why the other planets are different from one other. Although credible models of planet formation now exist, further measurements of solar system bodies and extrasolar objects could offer insight to the origin of Earth and the solar system.

What happened during earth's "dark age" (the first 500 million years)?

Scientists believe that another planet collided with Earth during the latter stages of its formation, creating debris that became the moon and causing Earth to melt down to its core. This period is critical to understanding planetary evolution, especially how the Earth developed its atmosphere and oceans, but scientists have little information because few rocks from this age are preserved.

How did life begin?

The origin of life is one of the most intriguing, difficult, and enduring questions in science. The only remaining evidence of where, when, and in what form life first appeared springs from geological investigations of rocks and minerals. To help answer the question, scientists are also turning toward Mars, where the sedimentary record of early planetary history predates the oldest Earth rocks, and other star systems with planets.

How does earth's interior work, and how does it affect the surface?

Scientists know that the mantle and core are in constant convective motion. Core convection produces Earth's magnetic field, which may influence surface conditions, and mantle convection causes volcanism, seafloor generation, and mountain building. However, scientists can neither precisely describe these motions, nor calculate how they were different in the past, hindering scientific understanding of the past and prediction of Earth's future surface environment.

Why does earth have plate tectonics and continents?

Although plate tectonic theory is well established, scientists wonder why Earth has plate tectonics and how closely it is related to other aspects of Earth, such as the abundance of water and the existence of the continents, oceans, and life. Moreover, scientists still do not know when continents first formed, how they remained preserved for billions of years, or how they are likely to evolve in the future. These are especially important questions as weathering of the continental crust plays a role in regulating Earth's climate.

How are earth processes controlled by material properties?

Scientists now recognize that macroscale behaviors, such as plate tectonics and mantle convection, arise from the microscale properties of Earth materials, including the smallest details of their atomic structures. Understanding materials at this microscale is essential to comprehending Earth's history and making reasonable predictions about how planetary processes may change in the future.

What causes climate to change -- and how much can it change?

Earth's surface temperature has remained within a relatively narrow range for most of the last 4 billion years, but how does it stay well-regulated in the long run, even though it can change so abruptly" Study of Earth's climate extremes through history -- when climate was extremely cold or hot or changed quickly -- may lead to improved climate models that could enable scientists to predict the magnitude and consequences of climate change.

How has life shaped earth -- and how has earth shaped life?

The exact ways in which geology and biology influence each other are still elusive. Scientists are interested in life's role in oxygenating the atmosphere and reshaping the surface through weathering and erosion. They also seek to understand how geological events caused mass extinctions and influenced the course of evolution.

Can earthquakes, volcanic eruptions, and their consequences be predicted?

Progress has been made in estimating the probability of future earthquakes, but scientists may never be able to predict the exact time and place an earthquake will strike. Nevertheless, they continue to decipher how fault ruptures start and stop and how much shaking can be expected near large earthquakes. For volcanic eruptions, geologists are moving toward predictive capabilities, but face the challenge of developing a clear picture of the movement of magma, from its sources in the upper mantle, through Earth's crust, to the surface where it erupts.

How do fluid flow and transport affect the human environment?


Good management of natural resources and the environment requires knowledge of the behavior of fluids, both below ground and at the surface, and scientists ultimately want to produce mathematical models that can predict the performance of these natural systems. Yet, it remains difficult to determine how subsurface fluids are distributed in heterogeneous rock and soil formations, how fast they flow, how effectively they transport dissolved and suspended materials, and how they are affected by chemical and thermal exchange with the host formations.


Adapted from materials provided by The National Academies.

How The Discovery Of Geologic Time Changed Our View Of The World

 In 1911 the discovery that the world was billions of years old changed our view of the world for ever.

Imagine trying to understand history without any dates. You know, for example, that the First World War came before the Second World War, but how long before? Was it tens, hundreds or even thousands of years before? In certain situations, before radiometric dating, there was no way of knowing.

By the end of the 19th century, many geologists still believed the age of the Earth to be a few thousand years old, as indicated by the Bible, while others considered it to be around 100 million years old, in line with calculations made by Lord Kelvin, the most prestigious physicist of his day.

Dr Cherry Lewis, University of Bristol, UK, said: "The age of the Earth was hugely important for people like Darwin who needed enormous amounts of time in which evolution could occur. As Thomas Huxley, Darwin's chief advocate said: 'Biology takes its time from Geology'."

In 1898 Marie Curie discovered the phenomenon of radioactivity and by 1904 Ernest Rutherford, a physicist working in Britain, realised that the process of radioactive decay could be harnessed to date rocks.

It was against this background of dramatic and exciting scientific discoveries that a young Arthur Holmes (1890-1964) completed his schooling and won a scholarship to study physics at the Royal College of Science in London. There he developed the technique of dating rocks using the uranium-lead method and from the age of his oldest rock discovered that the Earth was at least 1.6 billion years old (1,600 million).

But geologists were not as happy with the new results as, perhaps, they should have been. As Holmes, writing in Nature in 1913, put it: "the geologist who ten years ago was embarrassed by the shortness of time allowed to him for the evolution of the Earth's crust, is still more embarrassed with the superabundance with which he is now confronted." It continued to be hotly debated for decades.

Cherry Lewis commented, "In the 1920s, as the age of the Earth crept up towards 3 billion years, this took it beyond the age of the Universe, then calculated to be only 1.8 billion years old. It was not until the 1950s that the age of the Universe was finally revised and put safely beyond the age of the Earth, which had at last reached its true age of 4.56 billion years. Physicists suddenly gained a new respect for geologists!"

In the 1920s the new theory of continental drift became the great scientific conundrum, and most geologists were unable to accept the concept due to the lack of a mechanism for driving the continents around the globe.

In 1928 Arthur Holmes showed how convection currents in the substratum (now called the mantle) underlying the continents could be this mechanism. This proved to be correct but it was another 40 years before his theories were accepted and the theory of plate tectonics became a reality.

The theory of plate tectonics has proved to be as important as the theory of evolution and the discovery of the structure of the atom, but without the discovery of how to quantify geologic time, confirmation of plate tectonics would not have been possible.

Today, few discussions in geology can occur without reference to geologic time and plate tectonics. They are both integral to our way of thinking about the world. Holmes died in 1964 having lived just 
Adapted from materials provided by University of Bristol, via EurekAlert!, a service of AAAS.

Plate Tectonics May Grind To A Halt, Then Start Again


When an ocean plate collides with another ocean plate or with a plate carrying continents, one plate will bend and slide under the other. This process is called subduction. As the subducting plate plunges deep into the mantle, it gets so hot it melts the surrounding rock. The molten rock rises through the crust and erupts at the surface of the overriding plate.

(Credit: Woods Hole Oceanographic Institution)

---------------------------------------------------------------------------------------------------------------------------------------------


Plate tectonics, the geologic process responsible for creating the Earth's continents, mountain ranges, and ocean basins, may be an on-again, off-again affair. Scientists have assumed that the shifting of crustal plates has been slow but continuous over most of the Earth's history, but a new study from researchers at the Carnegie Institution suggests that plate tectonics may have ground to a halt at least once in our planet's history--and may do so again.


A key aspect of plate tectonic theory is that on geologic time scales ocean basins are transient features, opening and closing as plates shift. Basins are consumed by a process called subduction, where oceanic plates descend into the Earth's mantle. Subduction zones are the sites of oceanic trenches, high earthquake activity, and most of the world's major volcanoes.

Writing in the January 4 issue of Science, Paul Silver of the Carnegie Institution's Department of Terrestrial Magnetism and former postdoctoral fellow Mark Behn (now at Woods Hole Oceanographic Institution) point out that most of today's subduction zones are located in the Pacific Ocean basin. If the Pacific basin were to close, as it is predicted to do about in 350 million years when the westward-moving Americas collide with Eurasia, then most of the planet's subduction zones would disappear with it.

This would effectively stop plate tectonics unless new subduction zones start up, but subduction initiation is poorly understood. "The collision of India and Africa with Eurasia between 30 and 50 million years ago closed an ocean basin known as Tethys," says Silver. "But no new subduction zones have initiated south of either India or Africa to compensate for the loss of subduction by this ocean closure."

Silver and Behn also present geochemical evidence from ancient igneous rocks indicating that around one billion years ago there was a lull in the type of volcanic activity normally associated with subduction. This idea fits with other geologic evidence for the closure of a Pacific-type ocean basin at that time, welding the continents into a single "supercontinent" (known to geologists as Rodinia) and possibly snuffing out subduction for a while. Rodinia eventually split apart when subduction and plate tectonics resumed.

Plate tectonics is driven by heat flowing from the Earth's interior, and a stoppage would slow the rate of the Earth's cooling, just as clamping a lid on a soup pot would slow the soup's cooling. By periodically clamping the lid on heat flow, intermittent plate tectonics may explain why the Earth has lost heat slower than current models predict. And the buildup of heat beneath stagnant plates may explain the occurrence of certain igneous rocks in the middle of continents away from their normal locations in subduction zones.

"If plate tectonics indeed starts and stops, then continental evolution must be viewed in an entirely new light, since it dramatically broadens the range of possible evolutionary scenarios," says Silver.
Adapted from materials provided by Carnegie Institution, via EurekAlert!, a service of AAAS.

Earth's Ultraviolet Fingerprint


During the spacecraft’s approach, the Earth appeared as a crescent. The drawing (generated by the SwRI-developed Geometry Visualization tool) shows the appearance of the Earth as seen from the spacecraft. The red outline shows the orientation of the long slit off the Alice spectrograph. (Credit: SwRI)

----------------------------------------------------------------------------------------------------

NASA's Rosetta 'Alice' Spectrometer Reveals Earth's Ultraviolet Fingerprint in Earth Flyby

On November 13, the European Space Agency's comet orbiter spacecraft, Rosetta, swooped by Earth for its third and final gravity assist on the way to humankind's first rendezvous to orbit and study a comet in more detail than has ever been attempted.

One of the instruments aboard Rosetta is the NASA-funded ultraviolet spectrometer, Alice, which is designed to probe the composition of the comet's atmosphere and surface -- the first ultraviolet spectrometer ever to study a comet up close. During Rosetta's recent Earth flyby, researchers successfully tested Alice's performance by viewing the Earth's ultraviolet appearance.

"It's been over five years since Rosetta was launched on its 10-year journey to comet Churyumov-Gerasimenko, and Alice is working well," says instrument Principal Investigator Dr. Alan Stern, associate vice president of the Space Science and Engineering Division at Southwest Research Institute. "As one can see from the spectra we obtained during this flyby of the Earth, the instrument is in focus and shows the main ultraviolet spectral emission of our home planet. These data give a nice indication of the scientifically rich value of ultraviolet spectroscopy for studying the atmospheres of objects in space, and we're looking forward to reaching the comet and exploring its mysteries."

Dr. Paul Feldman, professor of Physics and Astronomy at the Johns Hopkins University, and an Alice co-investigator, has studied the Earth's upper atmosphere from the early days of space studies. "Although the Earth's ultraviolet emission spectrum was one of the first discoveries of the space age and has been studied by many orbiting spacecraft, the Rosetta flyby provides a unique view from which to test current models of the Sun's interaction with our atmosphere."

SwRI also developed and will operate the NASA-funded Ion and Electron Sensor aboard Rosetta. IES will simultaneously measure the flux of electrons and ions surrounding the comet over an energy range extending from the lower limits of detectability near 1 electron volt, up to 22,000 electron volts.

Thanks to an Earth gravity assist swing by in November, Rosetta is now on a course to meet its cometary target in mid-2014. Before Rosetta reaches its main target, it will explore a large asteroid called Lutetia, in July 2010. The Alice UV spectrometer will be one of the instruments mapping this ancient asteroid-

NASA's Jet Propulsion Laboratory, Pasadena, Calif., manages the U.S. Rosetta project for NASA's Science Mission Directorate.


Adapted from materials provided by Southwest Research Institute.

Seismic Gap South of Istanbul Poses Extreme Danger


Geoscientists expect an earthquake along the North Anatolian Fault. (Credit: Copyright GFZ)

-----------------------------------------------------------------------------------------------------

Earthquake Risk: Seismic Gap South of Istanbul Poses Extreme Danger

The chain of earthquakes along the North Anatolian fault shows a gap south of Istanbul. The expected earthquakes in this region represent an extreme danger for the Turkish megacity. A new computer study now shows that the tensions in this part of the fault zone could trigger several earthquakes instead of one individual large quake event.


In the latest issue of Nature Geoscience Tobias Hergert of the Karlsruhe Institute for Technology and Oliver Heidbach of the GFZ German Research Centre for Geosciences present the results of the computer simulation, which was developed within the framework of the CEDIM (Centre for Disaster Management and Risk Reduction Technology).project "Megacity Istanbul."

The Izmit-Earthquake of August 1999 resulted in 18,000 death victims and was, with a magnitude of 7.4, the most recent quake of a series, which began in 1939 to the east of Turkey and gradually ran along the plate border between the Anatolian and the Eurasian Plate from east to west. Therefore, the next quake in this series is expected to take place west of Izmit, i.e. south of Istanbul. The city has, thus, a threatening earthquake risk.

An important factor in judging seismic hazard is the movement rates of the tectonic fault. For their study Hergert and Heidbach divided the area into 640,000 elements, in order to determine, three-dimensionally, the kinetics of the fault system. "The model results show that the movement rates at the main fault are between 10 and 45% smaller than accepted to-date" explains Oliver Heidbach of the GFZ. "In addition the movement rates vary by 40% along the main fault." The authors interpret this variability as an indication that the built-up tension in the Earth's crust can also unload in two or three earthquakes with a smaller magnitude rather than in one enormous quake. This, however, by no means implies an all-clear for Istanbul. The authors explicitly point out in their article that the short distance of the main fault to Istanbul still represents an extreme earthquake risk for the megacity. The fault zone is less than 20 kilometres from the city boundary, disaster precaution before the occurrence of a quake is essential.


Adapted from materials provided by Helmholtz Centre Potsdam - GFZ German Research Centre for Geosciences.

Journal Reference:
Tobias Hergert, Oliver Heidbach. Slip-rate variability and distributed deformation in the Marmara Sea fault system. Nature Geoscience, 2010; DOI: 10.1038/ngeo739

San Andreas Fault Study Unearths New Earthquake Information


View of the "Southeast" channel of the Bidart fan, Carrizo Plain, looking downstream. The channel is offset approximately 10 meters by the San Andreas fault, at the bend in the middle ground of the photo, near the pump can. Trench 18, or "T18" (foreground) was excavated to exposure sediment in the channel for mapping and radiocarbon dating.

(Credit: Bidart Fan San Andreas fault research team, University of California Irvine and Arizona State University)

--------------------------------------------------------------------------------------------------------------------------------------------

Recent collaborative studies of stream channel offsets along the San Andreas Fault by researchers at Arizona State University and UC Irvine reveal new information about fault behavior -- affecting how we understand the potential for damaging earthquakes.

The researchers' findings encompasses their work at the Carrizo Plain, which is located 100 miles north of Los Angeles and site of the original "Big One" -- the Fort Tejon quake of 1857. Applying a system science approach, the ASU-UCI team presents a pair of studies appearing Jan. 21 at Science Express that incorporates the most comprehensive analysis of this part of the San Andreas fault system to date.

In one of the studies, Ramon Arrowsmith, an associate professor in the School of Earth and Space Exploration in ASU's College of Liberal Arts and Sciences, and Dr. Olaf Zielke employed topographic measurements from LiDAR (Light Detection and Ranging), which provide a view of the earth's surface at a resolution at least 10 times higher than previously available, enabling the scientists to "see" and measure fault movement, or offset.

To study older earthquakes, researchers turn to offset landforms such as stream channels which cross the fault at a high angle. A once straight stream channel will have a sharp jog right along the fault and indicate that prior offset.

This highly detailed overhead view of Carrizo Plain stream channels measured the offset features linked to large earthquakes in this section of the southern San Andreas Fault.

"This virtual approach is not a substitute for going out and looking at the features on the ground," says Zielke, who earned his Ph.D. at ASU under Arrowsmith. "But it is a powerful and somewhat objective approach that is also repeatable by other scientists."

In the second Science Express study, a team led by UCI's Lisa Grant Ludwig with postdoctoral scholar Sinan Akciz and Ph.D. candidate Gabriela Noriega determined the age of offset in a few Carrizo Plain dry stream channels by studying how much the fault slipped during previous earthquakes. The distance that a fault 'slips', or moves, determines its offset.

By digging trenches across the fault, radiocarbon-dating sediment samples and studying historic and older weather data of these Carrizo Plain channels, and combining them with the LiDAR data, the researchers found something other than what scientists had thought. Instead of having the same slip repeat in characteristic ways, researchers found that slip varied from earthquake to earthquake.

"When we combine our offset measurements with estimates of the ages of the offset features determined by Lisa's team and the ages of prior earthquakes, we find that the earthquake offset from event to event in the Carrizo Plain is not constant, as is current thinking" Arrowsmith said.

"The idea of slips repeating in characteristic ways along the San Andreas Fault is very appealing, because if you can that out, you are on your way to forecasting earthquakes with some reasonable confidence," added Ludwig, an associate professor of public health. "But our results show that we don't understand the San Andreas Fault as well as we thought we did, and therefore we don't know the chances of earthquakes as well as we thought we knew them."

Before these studies, the M 7.8 Fort Tejon earthquake of 1857 (the most recent earthquake along the southern San Andreas Fault) was thought to have caused a 9 to 10 meter slip along the Carrizo Plain. But the data the teams acquired show that it was actually half as much, and that slip in some of the prior earthquakes may have been even less. The researchers also found that none of the past five large earthquakes in the Carrizo Plain dating back 500 years produced slip anywhere near nine meters. In fact, the maximum slip seen was about 5-6 meters, which includes the slip caused by the Fort Tejon quake.

This result changes how we think the San Andreas Fault behaves: it probably is not as segmented in its release of accumulated stress. This makes forecasting future earthquakes a bit harder because we cannot rely on the assumption of constant behavior for each section. It could mean that earthquakes are more common along the San Andreas, but some of those events are probably smaller than we had previously expected.

Since the 1857 quake, an approximate five meters of strain, or potential slip, has been building up on the San Andreas Fault in the Carrizo Plain, ready to be released in a future earthquake. In the last five earthquakes, the most slip that has been released was 5-6 meters in the big 1857 quake. This finding points to the potential of a large temblor along the southern San Andreas Fault.

"Our collaboration has produced important information about how the San Andreas Fault works. Like all science, it is pushed forward by hard work, good ideas, and new technology. I am optimistic that these results, which change how we think about how faults work, are moving us to a more subtle understanding of the complexity of the earthquake process," said Arrowsmith.

"The recent earthquake in Haiti is a reminder that a destructive earthquake can strike without warning. One thing that hasn't changed is the importance of preparedness and earthquake resistant infrastructure in seismically active areas around the globe," Ludwig added.

Both studies were supported by the National Science Foundation, US Geological Survey, and Southern California Earthquake Center.
Adapted from materials provided by Arizona State University.

Monday, January 18, 2010

Haiti Earthquake Occurred in Complex, Active Seismic Region


The Haiti earthquake epicenter is marked by the star along the displaced portion (shown in red) of the Enriquillo-Plantain Garden Fault. The 7.0 magnitude quake struck along about one-tenth of the 500-km-long strike-slip fault. The region sits on a complex seismic area made up of numerous faults and plates. The fault lines with small arrows denote a different kind of fault called thrust faults, where one plate dives under another. Strike-slip faults grind past one another. The dotted lines at bottom denote complex seafloor formations.

------------------------------------------------------------------------------------------------------------------------------------------

The magnitude 7.0 earthquake that triggered disastrous destruction and mounting death tolls in Haiti this week occurred in a highly complex tangle of tectonic faults near the intersection of the Caribbean and North American crustal plates, according to a quake expert at the Woods Hole Oceanographic Institution (WHOI) who has studied faults in the region and throughout the world.

Jian Lin, a WHOI senior scientist in geology and geophysics, said that even though the quake was "large but not huge," there were three factors that made it particularly devastating: First, it was centered just 10 miles southwest of the capital city, Port au Prince; second, the quake was shallow -- only about 10-15 kilometers below the land's surface; third, and more importantly, many homes and buildings in the economically poor country were not built to withstand such a force and collapsed or crumbled.

All of these circumstances made the Jan. 12 earthquake a "worst-case scenario," Lin said. Preliminary estimates of the death toll ranged from thousands to hundreds of thousands. "It should be a wake-up call for the entire Caribbean," Lin said.

The quake struck on a 50-60-km stretch of the more than 500-km-long Enriquillo-Plantain Garden Fault, which runs generally east-west through Haiti, to the Dominican Republic to the east and Jamaica to the west.

It is a "strike-slip" fault, according to the U.S. Geological Survey, meaning the plates on either side of the fault line were sliding in opposite directions. In this case, the Caribbean Plate south of the fault line was sliding east and the smaller Gonvave Platelet north of the fault was sliding west.

But most of the time, the earth's plates do not slide smoothly past one another. They stick in one spot for perhaps years or hundreds of years, until enough pressure builds along the fault and the landmasses suddenly jerk forward to relieve the pressure, releasing massive amounts of energy throughout the surrounding area. A similar, more familiar, scenario exists along California's San Andreas Fault.

Such seismic areas "accumulate stresses all the time," says Lin, who has extensively studied a nearby, major fault , the Septentrional Fault, which runs east-west at the northern side of the Hispaniola island that makes up Haiti and Dominican Republic. In 1946, an 8.1 magnitude quake, more than 30 times more powerful than this week's quake, struck near the northeastern corner of the Hispaniola.

Compounding the problem, he says, is that in addition to the Caribbean and North American plates, , a wide zone between the two plates is made up of a patchwork of smaller "block" plates, or "platelets" -- such as the Gonvave Platelet -- that make it difficult to assess the forces in the region and how they interact with one another. "If you live in adjacent areas, such as the Dominican Republic, Jamaica and Puerto Rico, you are surrounded by faults."

Residents of such areas, Lin says, should focus on ways to save their lives and the lives of their families in the event of an earthquake. "The answer lies in basic earthquake education," he says.

Those who can afford it should strengthen the construction and stability of their houses and buildings, he says. But in a place like Haiti, where even the Presidential Palace suffered severe damage, there may be more realistic solutions.

Some residents of earthquake zones know that after the quake's faster, but smaller, primary, or "p" wave hits, there is usually a few-second-to-one-minute wait until a larger, more powerful surface, or "s" wave strikes, Lin says. P waves come first but have smaller amplitudes and are less destructive; S waves, though slower, are larger in amplitude and, hence, more destructive.

"At least make sure you build a strong table somewhere in your house and school," said Lin. When a quake comes, "duck quickly under that table."

Lin said the Haiti quake did not trigger an extreme ocean wave such as a Tsunami, partly because it was large but not huge and was centered under land rather than the sea.

The geologist says that aftershocks, some of them significant, can be expected in the coming days, weeks, months, years, "even tens of years." But now that the stress has been relieved along that 50-60-km portion of the Enriquillo-Plantain Garden Fault, Lin says this particular fault patch should not experience another quake of equal or greater magnitude for perhaps 100 years.

However, the other nine-tenths of that fault and the myriad networks of faults throughout the Caribbean are, definitely, "active."

"A lot of people," Lin says, "forget [earthquakes] quickly and do not take the words of geologists seriously. But if your house is close to an active fault, it is best that you do not forget where you live."
Adapted from materials provided by Woods Hole Oceanographic Institution.

ESA’s Ice Mission Arrives Safely at Launch Site


 ESA’s Earth Explorer CryoSat mission is dedicated to precise monitoring of the changes in the thickness of marine ice floating in the polar oceans and variations in the thickness of the vast ice sheets that overlay Greenland and Antarctica.

(Credit: ESA/AOES Medialab)

-------------------------------------------------------------------------------------------------------------------------------------------

In what might seem rather appropriate weather conditions, the CryoSat-2 Earth Explorer satellite has completed its journey to the Baikonur launch site in Kazakhstan, where it will be prepared for launch on 25 February.

The satellite and support equipment left the 'IABG' test centre in Ottobrunn, Germany, by lorry on 12 January. The CryoSat mission is dedicated to precise monitoring of the changes in the thickness of marine ice floating in the polar oceans and variations in the thickness of the vast ice sheets that overlay Greenland and Antarctica. With much of Europe still in the grip of one of the coldest winters for some years, the icy conditions aptly set the stage for this first leg of CryoSat-2's journey.

After arriving at Munich airport, the containers were loaded onto an Antonov aircraft. Along with team members from ESA and their industrial partner for CryoSat-2, EADS-Astrium, the Antonov took off in the early evening bound for Ulyanovsk, a city some 900 km east of Moscow, Russia. Once through customs clearance at Ulyanovsk, the aircraft continued the journey to the Baikonur Cosmodrome.

The weather was -12°C and fine on arrival. Safely cocooned in its thermally controlled container, CryoSat-2 and accompanying cargo were offloaded and moved to the integration facility. The launch campaign team will now spend the next six weeks preparing the satellite for launch. CryoSat-2 will be launched by a Dnepr rocket -- a converted intercontinental ballistic missile -- on 25 February at 14:57 CET (13:57 UT).

With the effects of a changing climate fast becoming apparent, particularly in the polar regions, it is increasingly important to understand exactly how Earth's ice fields are responding. Diminishing ice cover is frequently cited as an early casualty of global warming and because ice, in turn, plays an important role regulating climate and sea level, the consequences of change are far-reaching.

In order to understand fully how climate change is affecting these remote but sensitive regions, there remains an urgent need to determine exactly how the thickness of the ice, both on land and floating in the sea, is changing. By addressing this challenge, the data delivered by the CryoSat mission will complete the picture and lead to a better understanding of the role ice plays in the Earth system.

Following on from GOCE and SMOS, CryoSat-2 will be the third of ESA's Earth Explorers launched within 12 months, marking a significant step in ESA's dedication to improving our understanding of the Earth system.
Adapted from materials provided by European Space Agency.

Thursday, January 14, 2010

Biologists Wake Dormant Viruses and Uncover Mechanism for Survival


This shows the functioning of Kap1 protein in mouse embrocation cells.

(Credit: Pascal Coderay, pascal@salut.ch)

----------------------------------------------------------------------------------------------------

It is known that viral "squatters" comprise nearly half of our genetic code. These genomic invaders inserted their DNA into our own millions of years ago when they infected our ancestors. But just how we keep them quiet and prevent them from attack was more of a mystery until EPFL researchers revived them.

The reason we survive the presence of these endogenous retroviruses -- viruses that attack and are passed on through germ cells, the cells that give rise to eggs and sperm -- is because something keeps the killers silent. Now, publishing in the journal Nature, Didier Trono and his team from EPFL, in Switzerland, describe the mechanism. Their results provide insights into evolution and suggest potential new therapies in fighting another retrovirus -- HIV.

By analysing embryonic stem cells in mice within the first few days of life, Trono and team discovered that mouse DNA codes for an army of auxiliary proteins that recognize the numerous viral sequences littering the genome. The researchers also demonstrated that a master regulatory protein called KAP1 appears to orchestrate these inhibitory proteins in silencing would-be viruses. When KAP1 is removed, for example, the viral DNA "wakes up," multiplies, induces innumerable mutations, and the embryo soon dies.

Because retroviruses tend to mutate their host's DNA, they have an immense power and potential to alter genes. And during ancient pandemics, some individuals managed to silence the retrovirus involved and therefore survived to pass on the ability. Trono explains that the great waves of endogenous retrovirus appearance coincide with times when evolution seemed to leap ahead.

"In our genome we find traces of the last two major waves. The first took place 100 million years ago, at the time when mammals started to develop, and the second about fifty million years ago, just before the first anthropoid primates," he says.

The discovery of the KAP1 mechanism could be of interest in the search for new therapeutic approaches to combat AIDS. The virus that causes AIDS can lie dormant in the red blood cells it infects, keeping it hidden from potential treatments. Waking the virus up could expose it to attack.

Co-authors include Helen M. Rowe, School of Life Sciences, École Polytechnique Fédérale de Lausanne (EPFL), Switzerland; Johan Jakobsson, EPFL and Wallenberg Neuroscience Center, Department of Experimental Medical Sciences, Lund University, Sweden; Daniel Mesnard, EPFL; Jacques Rougemont, EPFL; Séverine Reynard, EPFL; Tugce Aktas, EMBL Heidelberg, Germany; Pierre V. Maillard, EPFL; Hillary Layard-Liesching, EPFL; Sonia Verp, EPFL; Julien Marquis, EPFL; François Spitz, EMBL Heidelberg, Germany; Daniel B. Constam, EPFL; and Didier Trono, EPFL.


Adapted from materials provided by Ecole Polytechnique Fédérale de Lausanne, via EurekAlert!, a service of AAAS.

Neanderthal Mind Capable of Advanced Thought


A perforated scallop shell from Cueva Antón.
(Credit: Image courtesy of University of Bristol)
----------------------------------------------------------------------------------------------------
Use of Body Ornamentation Shows Neanderthal Mind Capable of Advanced Thought
-----------------------------------------------------------------------------------------------------

The widespread view of Neanderthals as cognitively inferior to early modern humans is challenged by new research from the University of Bristol published in Proceedings of the National Academy of Sciences.

Professor João Zilhão and colleagues examined pigment-stained and perforated marine shells, most certainly used as neck pendants, from two Neanderthal-associated sites in the Murcia province of south-east Spain (Cueva de los Aviones and Cueva Antón). The analysis of lumps of red and yellow pigments found alongside suggest they were used in cosmetics. The practice of body ornamentation is widely accepted by archaeologists as conclusive evidence for modern behaviour and symbolic thinking among early modern humans but has not been recognised in Neanderthals -- until now.

Professor Zilhão said: "This is the first secure evidence that, some 50,000 years ago -- ten millennia before modern humans are first recorded in Europe -- the behaviour of Neanderthals was symbolically organised."

A Spondylus gaederopus shell from the same site contained residues of a reddish pigmentatious mass made of lepidocrocite mixed with ground bits of hematite and pyrite (which, when fresh, have a brilliant black, reflective appearance), suggesting the kind of inclusion 'for effect' that one would expect in a cosmetic preparation.

The choice of a Spondylus shell as the container for such a complex recipe may relate to the attention-grabbing crimson, red, or violet colour and exuberant sculpture of these shells, which have led to their symbolic- or ritual-related collection in a variety of archaeological contexts worldwide.

A concentration of lumps of yellow colorant from Cueva de los Aviones (most certainly the contents of a purse made of skin or other perishable material) was found to be pure natrojarosite -- an iron mineral used as a cosmetic in Ancient Egypt.

While functionally similar material has been found at Neanderthal-associated sites before, it has been explained by stratigraphic mixing (which can lead to confusion about the dating of particular artefacts), Neanderthal scavenging of abandoned modern human sites, or Neanderthal imitation without understanding of behaviours observed among contemporary modern human groups.

For example, controversy has surrounded the perforated and grooved teeth and decorated bone awls found in the Châtelperronian culture of France. In earlier work, Professor Zilhão and colleagues have argued they are genuine Neanderthal artefacts which demonstrate the independent evolution of advanced cognition in the Neanderthal lineage.

However, the Châtelperronian evidence dates from 40,000 to 45,000 years ago, thus overlapping with the period when anatomically modern human people began to disperse into Europe (between 40,000 and 42,000 years ago) and leaving open the possibility that these symbolic artifacts relate, in fact, to them.

Professor Zilhão said: "The evidence from the Murcian sites removes the last clouds of uncertainty concerning the modernity of the behaviour and cognition of the last Neanderthals and, by implication, shows that there is no reason any more to continue to question the Neanderthal authorship of the symbolic artefacts of the Châtelperronian culture.

"When considering the nature of the cultural and genetic exchanges that occurred between Neanderthals and modern humans at the time of contact in Europe, we should recognise that identical levels of cultural achievement had been reached by both sides."

Accurate radiocarbon dating of shell and charcoal samples from Cueva de los Aviones and Cueva Antón was crucial to the research. The dating was undertaken at the University of Oxford's Radiocarbon Accelerator Unit.

Dr Thomas Higham, Deputy Director of the Radiocarbon Unit in the School of Archaeology said: "Dating samples that approach the limit of the technique, at around 55,000 years before present, is a huge challenge. We used the most refined methods of pre-treatment chemistry to obtain accurate dates for the sites involved by removing small amounts of more modern carbon contamination to discover that the shells and charcoal samples were as early as 50,000 years ago."


Adapted from materials provided by University of Bristol.

Journal Reference:
João Zilhão, Diego E. Angelucci Ernestina Badal-García, Francesco d%u2019Errico, Floréal Daniel, Laure Dayet, Katerina Douka, Thomas F. G. Higham, María José Martínez-Sánchez, Ricardo Montes-Bernárdez, Sonia Murcia-Mascarós, Carmen Pérez-Sirvent, Clodoaldo Roldán-García, Marian Vanhaeren, Valentín Villaverde, Rachel Wood, and Josefina Zapata. Symbolic use of marine shells and mineral pigments by Iberian Neandertals. Proceedings of the National Academy of Sciences, Online Jan. 11, 2010

Microbe Understudies Await Their Turn


A 3-foot-long wreckfish swims by a portion of an 18-story (60 meter) chimney in the Lost City hydrothermal vent field. The white part of the edifice in the foreground is actively venting highly alkaline fluids rich in methane, hydrogen and abiogenic hydrocarbons. The warm, diffusely venting fluids support dense microbial communities that thrive on the chimney surface and interior.
(Credit: D. Kelley of University of Washington, IFE, URI-IAO, UW, Lost City science party, NOAA)
-------------------------------------------------------------------------------------------------
Microbe Understudies Await Their Turn in the Limelight: Deep-Sea 'Lost City' Shows Rare Microbes Can Become Dominant

On the marine microbial stage, there appears to be a vast, varied group of understudies only too ready to step in when "star" microbes falter.

At least that's what happens at the Lost City hydrothermal vent field, according to work led by the University of Washington and published in the Proceedings of the National Academy of Sciences.

The Lost City hydrothermal vent field in the mid-Atlantic Ocean is the only one of its kind found thus far. It offers scientists access to microorganisms living in vents that range in age from newly formed to tens of thousands of years old. A bit player found in scant numbers in the younger, more active vents became the lead actor in a chimney more than 1,000 years old where venting has moderated and cooled, changing the ecosystem.

This is the first evidence that microorganisms can remain rare for such a long time before completely turning the tables to become dominant when ecosystems change, according to William Brazelton, a University of Washington postdoctoral researcher. It seems logical, but until recently, scientists weren't able to detect microorganisms at such low abundance, Brazelton says.

It was in 2006 that scientists, led by Mitchell Sogin of the Marine Biological Laboratory at Woods Hole, Mass., and a co-author of the PNAS paper, published the first paper saying microorganisms in the marine environment had been woefully undercounted. They used the latest DNA sequencing techniques and said marine microorganisms could be 10 to 100 times more diverse than previously thought. They coined the term "rare biosphere" to describe a vast but unrecognized group of microorganisms -- "rare" because each kind of microorganism, or taxa, appeared to be present in only very low numbers or abundance, so low that they were previously undetectable.

If the new way of determining microbial diversity was accurate, scientists were left to wonder why such a large collection of low-abundance organisms existed.

"A fundamental prediction of the 'rare biosphere' model is that when environmental conditions change, some of these rare, preadapted taxa can rapidly exploit the new conditions, increase in abundance and out-complete the once abundant organisms that were adapted to past conditions," Brazelton and his co-authors wrote. Yet, they continued, "No studies have tested this prediction by examining a shift in species composition involving extremely rare taxa occurring during a known time interval."

Until now.

Lost City was discovered during a National Science Foundation expedition in 2000 by UW oceanography professor and paper co-author Deborah Kelley and others. They were on board the research vessel Atlantis, which is one reason the field was called Lost City. The hot springs form in a very different way from the metal-rich, 700 degrees F black smoker vents scientists have known about since the 1970s. Water venting at Lost City is generally 200 F or less and the chimneys, vents and other structures at Lost City are nearly pure carbonate, the same material as limestone in caves. They are formed by a process called serpentinization, a chemical reaction between seawater and mantle rocks that underlie the field. The vent waters are highly alkaline and enriched in methane and hydrogen gases -- important energy sources for the microbes that inhabit Lost City.

Lost City also differs from the magma-driven hydrothermal systems in that it is very long-lived.

Whereas there have been numerous seasonal and short-term studies of microbial responses to environmental changes -- lasting years at the most -- the Lost City hydrothermal vent field provided a way to look at changes in vent ecosystems 1,000 years apart in age.

Analyses by Brazelton and colleagues revealed that DNA sequences that were rare in younger vents were abundant in older ones. Because it is likely that the older Lost City chimneys vented higher-temperature, more alkaline fluids when they were younger, scientists think that as the ecosystem changed some of the rare microorganisms came to the fore.

This round of near-disappearance and then dominance could have happened repeatedly during the 30,000 year lifetime of the Lost City vent field so the microorganisms present today are "pre-adapted" to certain conditions and are just waiting for the ecosystem to suit them best.

"The rare biosphere of the Lost City microbial community represents a large repository of genetic memory created during a long history of past environmental changes," the authors write. "The rare organisms were able to rapidly exploit the new niches as they arose because they had been previously selected for the same conditions in the past."

Co-author Sogin says: "The ecological shifts over time spans of thousands of years at Lost City show that some of these rare organisms that are very closely related to the dominant taxa are not artifacts of DNA sequencing. The organisms are real, they are capable of growing and very subtle shifts resulted in them becoming winning populations."

The work was funded by the National Science Foundation, NASA and the W.M. Keck Foundation. Other co-authors on the paper are John Baross, UW professor of oceanography; Chuan-Chou Shen, National Taiwan University, Taipei; Lawrence Edwards, University of Minnesota, Minneapolis; and Kristin Ludwig, recent UW graduate now at the Consortium for Ocean Leadership, Washington, D.C.


Adapted from materials provided by University of Washington.

How Galaxies Came to Be

How Galaxies Came to Be: Astronomers Explain Hubble Sequence

For the first time, two astronomers have explained the diversity of galaxy shapes seen in the universe. The scientists, Dr Andrew Benson of the California Institute of Technology (Caltech) and Dr Nick Devereux of Embry-Riddle University in Arizona, tracked the evolution of galaxies over thirteen billion years from the early Universe to the present day.

Their results appear in the journal Monthly Notices of the Royal Astronomical Society.

Galaxies are the collections of stars, planets, gas and dust that make up most of the visible component of the cosmos. The smallest have a few million and the largest as many as a million million (a trillion) stars.

American astronomer Edwin Hubble first developed a taxonomy for galaxies in the 1930s that has since become known as the 'Hubble Sequence'. There are three basic shapes: spiral, where arms of material wind out in a disk from a small central bulge, barred spirals, where the arms wind out in a disk from a larger bar of material and elliptical, where the galaxy's stars are distributed more evenly in a bulge without arms or disk. For comparison, the galaxy we live in, the Milky Way, has between two and four hundred thousand million stars and is classified as a barred spiral.

Explaining the Hubble Sequence is complex. The different types clearly result from different evolutionary paths but until now a detailed explanation has eluded scientists.

Benson and Devereux combined data from the infrared Two Micron All Sky Survey (2MASS) with their sophisticated GALFORM computer model to reproduce the evolutionary history of the Universe over thirteen billion years. To their surprise, their computations reproduced not only the different galaxy shapes but also their relative numbers.

"We were completely astonished that our model predicted both the abundance and diversity of galaxy types so precisely," said Devereux. "It really boosts my confidence in the model," added Benson.

The astronomers' model is underpinned by and endorses the 'Lambda Cold Dark Matter' model of the Universe. Here 'Lambda' is the mysterious 'dark energy' component believed to make up about 72% of the cosmos, with cold dark matter making up another 23%. Just 4% of the Universe consists of the familiar visible or 'baryonic' matter that makes up the stars and planets of which galaxies are comprised.

Galaxies are thought to be embedded in very large haloes of dark matter and Benson and Devereux believe these to be crucial to their evolution. Their model suggests that the number of mergers between these haloes and their galaxies drives the final outcome -- elliptical galaxies result from multiple mergers whereas disk galaxies have seen none at all. Our Milky Way galaxy's barred spiral shape suggests it has seen a complex evolutionary history, with only a few minor collisions and at least one episode where the inner disk collapsed to form the large central bar.

"These new findings set a clear direction for future research. Our goal now is to compare the model predictions with observations of more distant galaxies seen in images obtained with the Hubble and those of the soon to be launched James Webb Space Telescope (JWST)," said Devereux.


Adapted from materials provided by California Institute of Technology, via EurekAlert!, a service of AAAS.

Astronomers Capture First Direct Spectrum of an Exoplanet

 By studying a triple planetary system that resembles a scaled-up version of our own Sun's family of planets, astronomers have been able to obtain the first direct spectrum -- the "chemical fingerprint" [1] -- of a planet orbiting a distant star [2], thus bringing new insights into the planet's formation and composition. The result represents a milestone in the search for life elsewhere in the Universe.

The spectrum of a planet is like a fingerprint. It provides key information about the chemical elements in the planet's atmosphere," says Markus Janson, lead author of a paper reporting the new findings. "With this information, we can better understand how the planet formed and, in the future, we might even be able to find tell-tale signs of the presence of life."

The researchers obtained the spectrum of a giant exoplanet that orbits the bright, very young star HR 8799. The system is at about 130 light-years from Earth. The star has 1.5 times the mass of the Sun, and hosts a planetary system that resembles a scaled-up model of our own Solar System. Three giant companion planets were detected in 2008 by another team of researchers, with masses between 7 and 10 times that of Jupiter. They are between 20 and 70 times as far from their host star as the Earth is from the Sun; the system also features two belts of smaller objects, similar to our Solar System's asteroid and Kuiper belts.

"Our target was the middle planet of the three, which is roughly ten times more massive than Jupiter and has a temperature of about 800 degrees Celsius," says team member Carolina Bergfors. "After more than five hours of exposure time, we were able to tease out the planet's spectrum from the host star's much brighter light."

This is the first time the spectrum of an exoplanet orbiting a normal, almost Sun-like star has been obtained directly. Previously, the only spectra to be obtained required a space telescope to watch an exoplanet pass directly behind its host star in an "exoplanetary eclipse," and then the spectrum could be extracted by comparing the light of the star before and after. However, this method can only be applied if the orientation of the exoplanet's orbit is exactly right, which is true for only a small fraction of all exoplanetary systems. The present spectrum, on the other hand, was obtained from the ground, using ESO's Very Large Telescope (VLT), in direct observations that do not depend on the orbit's orientation.

As the host star is several thousand times brighter than the planet, this is a remarkable achievement. "It's like trying to see what a candle is made of, by observing it from a distance of two kilometres when it's next to a blindingly bright 300 Watt lamp," says Janson.

The discovery was made possible by the infrared instrument NACO, mounted on the VLT, and relied heavily on the extraordinary capabilities of the instrument's adaptive optics system [3]. Even more precise images and spectra of giant exoplanets are expected both from the next generation instrument SPHERE, to be installed on the VLT in 2011, and from the European Extremely Large Telescope.

The newly collected data show that the atmosphere enclosing the planet is still poorly understood. "The features observed in the spectrum are not compatible with current theoretical models," explains co-author Wolfgang Brandner. "We need to take into account a more detailed description of the atmospheric dust clouds, or accept that the atmosphere has a different chemical composition from that previously assumed."

The astronomers hope to soon get their hands on the fingerprints of the other two giant planets so they can compare, for the first time, the spectra of three planets belonging to the same system. "This will surely shed new light on the processes that lead to the formation of planetary systems like our own," concludes Janson.

Notes

[1] As every rainbow demonstrates, white light can be split up into different colours. Astronomers artificially split up the light they receive from distant objects into its different colours (or "wavelengths"). However, where we distinguish five or six rainbow colours, astronomers map hundreds of finely nuanced colours, producing a spectrum -- a record of the different amounts of light the object emits in each narrow colour band. The details of the spectrum -- more light emitted at some colours, less light at others -- provide tell-tale signs about the chemical composition of the matter producing the light. This makes spectroscopy, the recording of spectra, an important investigative tool in astronomy.

[2] In 2004, astronomers used NACO on the VLT to obtain an image and a spectrum of a 5 Jupiter mass object around a brown dwarf -- a "failed star." It is however thought that the pair probably formed together, like a petite stellar binary, instead of the companion forming in the disc around the brown dwarf, like a star-planet system.

[3] Telescopes on the ground suffer from a blurring effect introduced by atmospheric turbulence. This turbulence causes the stars to twinkle in a way that delights poets but frustrates astronomers, since it smears out the fine details of the images. However, with adaptive optics techniques, this major drawback can be overcome so that the telescope produces images that are as sharp as theoretically possible, i.e. approaching conditions in space. Adaptive optics systems work by means of a computer-controlled deformable mirror that counteracts the image distortion introduced by atmospheric turbulence. It is based on real-time optical corrections computed at very high speed (several hundreds of times each second) from image data obtained by a wavefront sensor (a special camera) that monitors light from a reference star.

More information

This research was presented in a paper in press as a Letter to the Astrophysical Journal ("Spatially resolved spectroscopy of the exoplanet HR 8799 c," by M. Janson et al.).

The team is composed of M. Janson (University of Toronto, Canada), C. Bergfors, M. Goto, W. Brandner (Max-Planck-Institute for Astronomy, Heidelberg, Germany) and D. Lafrenière (University of Montreal, Canada). Preparatory data were taken with the IRCS instrument at the Subaru telescope.
Adapted from materials provided by ESO.

Journal Reference:
M. Janson et al. Spatially resolved spectroscopy of the exoplanet HR 8799 c. Astrophysical Journal, 2010 (in press).

Wednesday, January 6, 2010

Massive Black Hole Implicated in Stellar Destruction


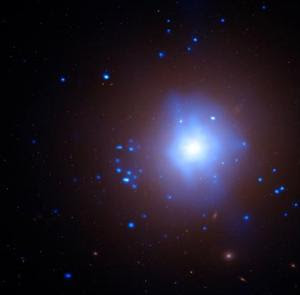
Evidence from NASA's Chandra X-ray Observatory and the Magellan telescopes suggest a star has been torn apart by an intermediate-mass black hole in a globular cluster. In this image, X-rays from Chandra are shown in blue and are overlaid on an optical image from the Hubble Space Telescope. The Chandra observations show that this object is a so-called ultraluminous X-ray source (ULX). (Credit: X-ray: NASA/CXC/UA/J. Irwin; Optical: NASA/STScI

-----------------------------------------------------------------------------------------------------------------------------------------

New results from NASA's Chandra X-ray Observatory and the Magellan telescopes suggest that a dense stellar remnant has been ripped apart by a black hole a thousand times as massive as the Sun.

If confirmed, this discovery would be a cosmic double play: it would be strong evidence for an intermediate mass black hole, which has been a hotly debated topic, and would mark the first time such a black hole has been caught tearing a star apart.

This scenario is based on Chandra observations, which revealed an unusually luminous source of X-rays in a dense cluster of old stars, and optical observations that showed a peculiar mix of elements associated with the X-ray emission. Taken together, a case can be made that the X-ray emission is produced by debris from a disrupted white dwarf star that is heated as it falls towards a massive black hole. The optical emission comes from debris further out that is illuminated by these X-rays.

The intensity of the X-ray emission places the source in the "ultraluminous X-ray source" or ULX category, meaning that it is more luminous than any known stellar X-ray source, but less luminous than the bright X-ray sources (active galactic nuclei) associated with supermassive black holes in the nuclei of galaxies. The nature of ULXs is a mystery, but one suggestion is that some ULXs are black holes with masses between about a hundred and several thousand times that of the Sun, a range intermediate between stellar-mass black holes and supermassive black holes located in the nuclei of galaxies.

This ULX is in a globular cluster, a very old and crowded conglomeration of stars. Astronomers have suspected that globular clusters could contain intermediate-mass black holes, but conclusive evidence for this has been elusive.

"Astronomers have made cases for stars being torn apart by supermassive black holes in the centers of galaxies before, but this is the first good evidence for such an event in a globular cluster," said Jimmy Irwin of the University of Alabama who led the study.

Irwin and his colleagues obtained optical spectra of the object using the Magellan I and II telescopes in Las Campanas, Chile. These data reveal emission from gas rich in oxygen and nitrogen but no hydrogen, a rare set of signals from globular clusters. The physical conditions deduced from the spectra suggest that the gas is orbiting a black hole of at least 1,000 solar masses. The abundant amount of oxygen and absence of hydrogen indicate that the destroyed star was a white dwarf, the end phase of a solar-type star that has burned its hydrogen leaving a high concentration of oxygen. The nitrogen seen in the optical spectrum remains an enigma.

"We think these unusual signatures can be explained by a white dwarf that strayed too close to a black hole and was torn apart by the extreme tidal forces," said coauthor Joel Bregman of the University of Michigan.

Theoretical work suggests that the tidal disruption-induced X-ray emission could stay bright for more than a century, but it should fade with time. So far, the team has observed there has been a 35 percent in X-ray emission from 2000 to 2008.

The ULX in this study is located in NGC 1399, an elliptical galaxy about 65 million light years from Earth.

Irwin presented these results at the 215th meeting of the American Astronomical Society in Washington, DC. NASA's Marshall Space Flight Center in Huntsville, Ala., manages the Chandra program for NASA's Science Mission Directorate in Washington. The Smithsonian Astrophysical Observatory controls Chandra's science and flight operations from Cambridge, Mass.

More information, including images and other multimedia, can be found at:

http://chandra.harvard.edu
Adapted from materials provided by NASA/Marshall Space Flight Center.

Five New Exoplanets Discovered By NASA's Kepler Space Telescope


Comparison of sizes of the latest exoplanets discovered by NASA's Kepler space telescope, next to Earth on the right. (Credit: NASA)

------------------------------------------------------------------------------------------------------------------------------------------

NASA's Kepler space telescope, designed to find Earth-size planets in the habitable zone of sun-like stars, has discovered its first five new exoplanets, or planets beyond our solar system.

Kepler's high sensitivity to both small and large planets enabled the discovery of the exoplanets, named Kepler 4b, 5b, 6b, 7b and 8b. The discoveries were announced Monday, Jan. 4, by members of the Kepler science team during a news briefing at the American Astronomical Society meeting in Washington.

"These observations contribute to our understanding of how planetary systems form and evolve from the gas and dust disks that give rise to both the stars and their planets," said William Borucki of NASA's Ames Research Center in Moffett Field, Calif. Borucki is the mission's science principal investigator. "The discoveries also show that our science instrument is working well. Indications are that Kepler will meet all its science goals."

Known as "hot Jupiters" because of their high masses and extreme temperatures, the new exoplanets range in size from similar to Neptune to larger than Jupiter. They have orbits ranging from 3.3 to 4.9 days. Estimated temperatures of the planets range from 2,200 to 3,000 degrees Fahrenheit, hotter than molten lava and much too hot for life as we know it. All five of the exoplanets orbit stars hotter and larger than Earth's sun.

"It's gratifying to see the first Kepler discoveries rolling off the assembly line," said Jon Morse, director of the Astrophysics Division at NASA Headquarters in Washington. "We expected Jupiter-size planets in short orbits to be the first planets Kepler could detect. It's only a matter of time before more Kepler observations lead to smaller planets with longer-period orbits, coming closer and closer to the discovery of the first Earth analog."

Launched on March 6, 2009, from Cape Canaveral Air Force Station in Florida, the Kepler mission continuously and simultaneously observes more than 150,000 stars. Kepler's science instrument, or photometer, already has measured hundreds of possible planet signatures that are being analyzed.

While many of these signatures are likely to be something other than a planet, such as small stars orbiting larger stars, ground-based observatories have confirmed the existence of the five exoplanets. The discoveries are based on approximately six weeks' worth of data collected since science operations began on May 12, 2009.

Kepler looks for the signatures of planets by measuring dips in the brightness of stars. When planets cross in front of, or transit, their stars as seen from Earth, they periodically block the starlight. The size of the planet can be derived from the size of the dip. The temperature can be estimated from the characteristics of the star it orbits and the planet's orbital period.

Kepler will continue science operations until at least November 2012. It will search for planets as small as Earth, including those that orbit stars in a warm, habitable zone where liquid water could exist on the surface of the planet. Since transits of planets in the habitable zone of solar-like stars occur about once a year and require three transits for verification, it is expected to take at least three years to locate and verify an Earth-size planet.

According to Borucki, Kepler's continuous and long-duration search should greatly improve scientists' ability to determine the distributions of planet size and orbital period in the future. "Today's discoveries are a significant contribution to that goal," Borucki said. "The Kepler observations will tell us whether there are many stars with planets that could harbor life, or whether we might be alone in our galaxy."

Kepler is NASA's 10th Discovery mission. NASA Ames is responsible for the ground system development, mission operations and science data analysis. NASA's Jet Propulsion Laboratory in Pasadena, Calif., managed the Kepler mission development. Ball Aerospace & Technologies Corp. of Boulder, Colo., was responsible for developing the Kepler flight system. Ball and the Laboratory for Atmospheric and Space Physics at the University of Colorado in Boulder are supporting mission operations. The California Institute of Technology in Pasadena manages JPL for NASA.

Ground observations necessary to confirm the discoveries were conducted with ground-based telescopes: the Keck I in Hawaii; Hobby-Ebberly and Harlan J. Smith 2.7m in Texas; Hale and Shane in California; WIYN, MMT and Tillinghast in Arizona; and Nordic Optical in the Canary Islands, Spain. For more information about the Kepler mission, visit http://www.nasa.gov/kepler
Adapted from materials provided by NASA/Jet Propulsion Laboratory.

Hubble's New find

Hubble Reaches 'Undiscovered Country' of Most Distant Primeval Galaxies

NASA's Hubble Space Telescope has broken the distance limit for galaxies and uncovered a primordial population of compact and ultra-blue galaxies that have never been seen before.

The deeper Hubble looks into space, the farther back in time it looks, because light takes billions of years to cross the observable universe. This makes Hubble a powerful "time machine" that allows astronomers to see galaxies as they were 13 billion years ago, just 600 million to 800 million years after the Big Bang.

The data from Hubble's new infrared camera, the Wide Field Camera 3 (WFC3), on the Ultra Deep Field (taken in August 2009) have been analyzed by no less than five international teams of astronomers. A total of 15 papers have been submitted to date by astronomers worldwide. Some of these early results are being presented by various team members on Jan. 6, 2010, at the 215th meeting of the American Astronomical Society in Washington, D.C.

"With the rejuvenated Hubble and its new instruments, we are now entering unchartered territory that is ripe for new discoveries," says Garth Illingworth of the University of California, Santa Cruz, leader of the survey team that was awarded the time to take the new WFC3 infrared data on the Hubble Ultra Deep Field (imaged in visible light by the Advanced Camera for Surveys in 2004). "The deepest-ever near-infrared view of the universe -- the HUDF09 image -- has now been combined with the deepest-ever optical image -- the original HUDF (taken in 2004) -- to push back the frontiers of the searches for the first galaxies and to explore their nature," Illingworth says.

Rychard Bouwens of the University of California, Santa Cruz, a member of Illingworth's team and leader of a paper on the striking properties of these galaxies, says that, "the faintest galaxies are now showing signs of linkage to their origins from the first stars. They are so blue that they must be extremely deficient in heavy elements, thus representing a population that has nearly primordial characteristics."

James Dunlop of the University of Edinburgh, agrees. "These galaxies could have roots stretching into an earlier population of stars. There must be a substantial component of galaxies beyond Hubble's detection limit."

Three teams worked hard to find these new galaxies and did so in a burst of papers immediately after the data were released in September, soon followed by a fourth team, and later a fifth team. The existence of these newly found galaxies pushes back the time when galaxies began to form to before 500-600 million years after the Big Bang. This is good news for astronomers building the much more powerful James Webb Space Telescope (planned for launch in 2014), which will allow astronomers to study the detailed nature of primordial galaxies and discover many more even farther away. There should be a lot for Webb to hunt for.

The deep observations also demonstrate the progressive buildup of galaxies and provide further support for the hierarchical model of galaxy assembly where small objects accrete mass, or merge, to form bigger objects over a smooth and steady but dramatic process of collision and agglomeration. It's like streams merging into tributaries and then into a bay.

These galaxies are as small as 1/20th the Milky Way's diameter," reports Pascal Oesch of the Swiss Federal Institute of Technology in Zurich. "Yet they are the very building blocks from which the great galaxies of today, like our own Milky Way, ultimately formed," explains Marcella Carollo, also of the Swiss Federal Institute of Technology in Zurich. Oesch and Carollo are members of Illingworth's team.

These newly found objects are crucial to understanding the evolutionary link between the birth of the first stars, the formation of the first galaxies, and the sequence of evolutionary events that resulted in the assembly of our Milky Way and the other "mature" elliptical and majestic spiral galaxies in today's universe.

The HUDF09 team also combined the new Hubble data with observations from NASA's Spitzer Space Telescope to estimate the ages and masses of these primordial galaxies. "The masses are just 1 percent of those of the Milky Way," explains team member Ivo Labbe of the Carnegie Institute of Washington, leader of two papers on the data from the combined NASA Great Observatories. He further noted that "to our surprise, the results show that these galaxies at 700 million years after the Big Bang must have started forming stars hundreds of millions of years earlier, pushing back the time of the earliest star formation in the universe."

The results are gleaned from the HUDF09 observations, which are deep enough at near-infrared wavelengths to reveal galaxies at redshifts from z=7 to beyond redshift z=8. (The redshift value z is a measure of the stretching of the wavelength or "reddening" of starlight due to the expansion of space.) The clear detection of galaxies between z=7 and z=8.5 corresponds to "look-back times" of approximately 12.9 billion years to 13.1 billion years ago.

"This is about as far as we can go to do detailed science with the new HUDF09 image. This shows just how much the James Webb Space Telescope (JWST) is needed to unearth the secrets of the first galaxies," says Illingworth. The challenge is that spectroscopy is needed to provide definitive redshift values, but the objects are too faint for spectroscopic observations (until JWST is launched). Therefore, the redshifts are inferred by the galaxies' apparent colors through a now very well-established technique.

The teams are finding that the number of galaxies per unit of volume of space drops off smoothly with increasing distance, and the HUDF09 team has also found that the galaxies become surprisingly blue intrinsically. The ultra-blue galaxies are extreme examples of objects that appear so blue because they may be deficient in heavier elements, and as a result, quite free of the dust that reddens light through scattering.

A longstanding problem with these findings is that it still appears that these early galaxies did not put out enough radiation to "reionize" the early universe by stripping electrons off the neutral hydrogen that cooled after the Big Bang. This "reionization" event occurred between about 400 million and 900 million years after the Big Bang, but astronomers still don't know which sources of light caused it to happen. These new galaxies are being seen right in this important epoch in the evolution of the universe.

Perhaps the density of very faint galaxies below the current detection limit is so high that there may be enough of them to support reionization. Or there was an earlier wave of galaxy formation that decayed and then was "rebooted" by a second wave of galaxy formation. Or, possibly the early galaxies were extraordinarily efficient at reionizing the universe.

Due to these uncertainties it is not clear what type of object or evolutionary process did the "heavy lifting" by ionizing the young universe. The calculations remain rather uncertain, and so galaxies may do more than currently expected, or astronomers may need to invoke other phenomena such as mini-quasars (active supermassive black holes in the cores of galaxies) -- current estimates suggest however that quasars are even less likely than galaxies to be the cause of reionization. This is an enigma that still challenges astronomers and the very best telescopes.

"As we look back into the epoch of the first galaxies in the universe, from a redshift of 6 to a redshift of 8 and possibly beyond, these new observations indicate that we are likely seeing the end of reionization, and perhaps even into the reionization era, which is the last major phase transition of the gas in the universe," says Rogier Windhorst of Arizona State University, leader of one of the other teams that analyzed the WFC3 data. "Though the exact interpretation of these new results remains under debate, these new WFC3 data may provide an exciting new view of how galaxy formation proceeded during and at the end of the reionization era."

Hubble's WFC3/IR camera was able to make deep exposures to uncover new galaxies at roughly 40 times greater efficiency than its earlier infrared camera that was installed in 1997. The WFC3/IR brought new infrared technology to Hubble and accomplished in four days of observing what would have previously taken almost half a year for Hubble to do.
Adapted from materials provided by Space Telescope Science Institute.+

Giant Intergalactic Gas Stream Longer Than Thought

A giant stream of gas flowing from neighbor galaxies around our own Milky Way is much longer and older than previously thought, astronomers have discovered. The new revelations provide a fresh insight on what started the gaseous intergalactic streamer.

The astronomers used the National Science Foundation's Robert C. Byrd Green Bank Telescope (GBT) to fill important gaps in the picture of gas streaming outward from the Magellanic Clouds. The first evidence of such a flow, named the Magellanic Stream, was discovered more than 30 years ago, and subsequent observations added tantalizing suggestions that there was more. However, the earlier picture showed gaps that left unanswered whether this other gas was part of the same system.

"We now have answered that question. The stream is continuous," said David Nidever, of the University of Virginia. "We now have a much more complete map of the Magellanic Stream," he added. The astronomers presented their findings to the American Astronomical Society's meeting in Washington, DC.

The Magellanic Clouds are the Milky Way's two nearest neighbor galaxies, about 150,000 to 200,000 light-years distant from the Milky Way. Visible in the Southern Hemisphere, they are much smaller than our Galaxy and may have been distorted by its gravity.

Nidever and his colleagues observed the Magellanic Stream for more than 100 hours with the GBT. They then combined their GBT data with that from earlier studies with other radio telescopes, including the Arecibo telescope in Puerto Rico, the Parkes telescope in Australia, and the Westerbork telescope in the Netherlands. The result shows that the stream is more than 40 percent longer than previously known with certainty.

One consequence of the added length of the gas stream is that it must be older, the astronomers say. They now estimate the age of the stream at 2.5 billion years.

The revised size and age of the Magellanic Stream also provides a new potential explanation for how the flow got started.

"The new age of the stream puts its beginning at about the time when the two Magellanic Clouds may have passed close to each other, triggering massive bursts of star formation," Nidever explained. "The strong stellar winds and supernova explosions from that burst of star formation could have blown out the gas and started it flowing toward the Milky Way," he said.

"This fits nicely with some of our earlier work that showed evidence for just such blowouts in the Magellanic Clouds," said Steven Majewski, of the University of Virginia.

Earlier explanations for the stream's cause required the Magellanic Clouds to pass much closer to the Milky Way, but recent orbital simulations have cast doubt on such mechanisms.

Nidever and Majewski worked with Butler Burton of the Leiden Observatory and the National Radio Astronomy Observatory, and Lou Nigra of the University of Wisconsin. In addition to presenting the results to the American Astronomical Society, the scientists have submitted a paper to the Astrophysical Journal.
Adapted from materials provided by National Radio Astronomy Observatory.

Friday, January 1, 2010

Fast Pace of Glacier Melt in the 1940s: Lower Aerosol Pollution


Gorner glacier. In the 1940s, the glaciers were melting at a faster pace than today.

(Credit: Matthias Huss / ETH Zurich)

--------------------------------------------------------------------------------------------------

The most recent studies by researchers at ETH Zurich show that in the 1940s Swiss glaciers were melting at an even-faster pace than at present. This is despite the fact that the temperatures in the 20th century were lower than in this century. Researchers see the main reason for this as the lower level of aerosol pollution in the atmosphere.

In Switzerland, the increase in snow in wintertime and the glacier melt in summertime have been measured at measurement points at around 3,000 metres above sea level -- on the Clariden Firn, the Great Aletsch glacier and the Silvretta glacier -- without interruption for almost 100 years. As part of his doctoral work, Matthias Huss used this unique range of measurements to examine how climate change in the last century affected the glaciers. The work was carried out under the supervision of Martin Funk, professor and head of the Department for Glaciology at the Laboratory for Hydraulics, Hydrology and Glaciology ('VAW') at ETH Zurich, who is also co-author of the study.

Solar radiation as the decisive factor

In its work, the research team took into account the solar radiation measured on the Earth's surface in Davos since 1934. Studies over the past two decades have shown that solar radiation varies substantially due to aerosols and clouds, and this is assumed to influence climate fluctuations. Recent years have seen the emergence of the terms 'global dimming' and 'global brightening' to describe these phenomena of reduced and increased solar radiation respectively. These two effects are currently the subject of more and more scientific research, in particular by ETH Zurich, as experts feel that they should be taken into account in the climate models.

The new study, published in the journal 'Geophysical Research Letters', confirms this requirement. This is because, taking into account the data recorded for the level of solar radiation, the scientists made a surprising discovery: in the 1940s and in the summer of 1947 especially, the glaciers lost the most ice since measurements commenced in 1914. This is in spite of the fact that temperatures were lower than in the past two decades. "The surprising thing is that this paradox can be explained relatively easily with radiation," says Huss, who was recently appointed to the post of senior lecturer at the Department of Geosciences at the University of Fribourg in Switzerland.

On the basis of their calculations, the researchers have concluded that the high level of short-wave radiation in the summer months is responsible for the fast pace of glacier melt. In the 1940s, the level was 8% higher than the long-term average and 18 Watts per square metres above the levels of the past ten years. Calculated over the entire decade of the 1940s, this resulted in 4% more snow and ice melt compared with the past ten years.

Furthermore, the below-average melt rates at the measurement points during periods in which the glacier snouts were even advancing correlate with a phase of global dimming, between the 1950s and the 1980s.

Less snow fall and longer melt periods

The researchers arrived at their findings by calculating the daily melt rates with the aid of climate data and a temperature index model, based on the half-yearly measurements on the glaciers since 1914. These results were then compared with the long-term measurements of solar radiation in Davos.

Huss points out that the strong glacier melt in the 1940s puts into question the assumption that the rate of glacier decline in recent years "has never been seen before." "Nevertheless," says the glaciologist, "this should not lead people to conclude that the current period of global warming is not really as big of a problem for the glaciers as previously assumed." This is because it is not only the pace at which the Alpine glaciers are currently melting that is unusual, but the fact that this sharp decline has been unabated for 25 years now.

Another aspect to consider -- and this is evidenced by the researchers' findings -- is that temperature-based opposing mechanisms came into play around 30 years ago. These have led to a 12% decrease in the amount of precipitation that falls as snow as a percentage of total precipitation, accompanied by an increase of around one month in the length of the melt period ever since this time. Scientists warn that these effects could soon be matched by the lower level of solar radiation we have today compared with the 1940s.
Story Source:
Adapted from materials provided by ETH Zurich.

Journal Reference:
Huss et al. Strong Alpine glacier melt in the 1940s due to enhanced solar radiation. Geophysical Research Letters, 2009; 36 (23): L23501 DOI: 10.1029/2009GL040789